The Case for Reprocessing MRF Residue: A Financial and Operational Analysis
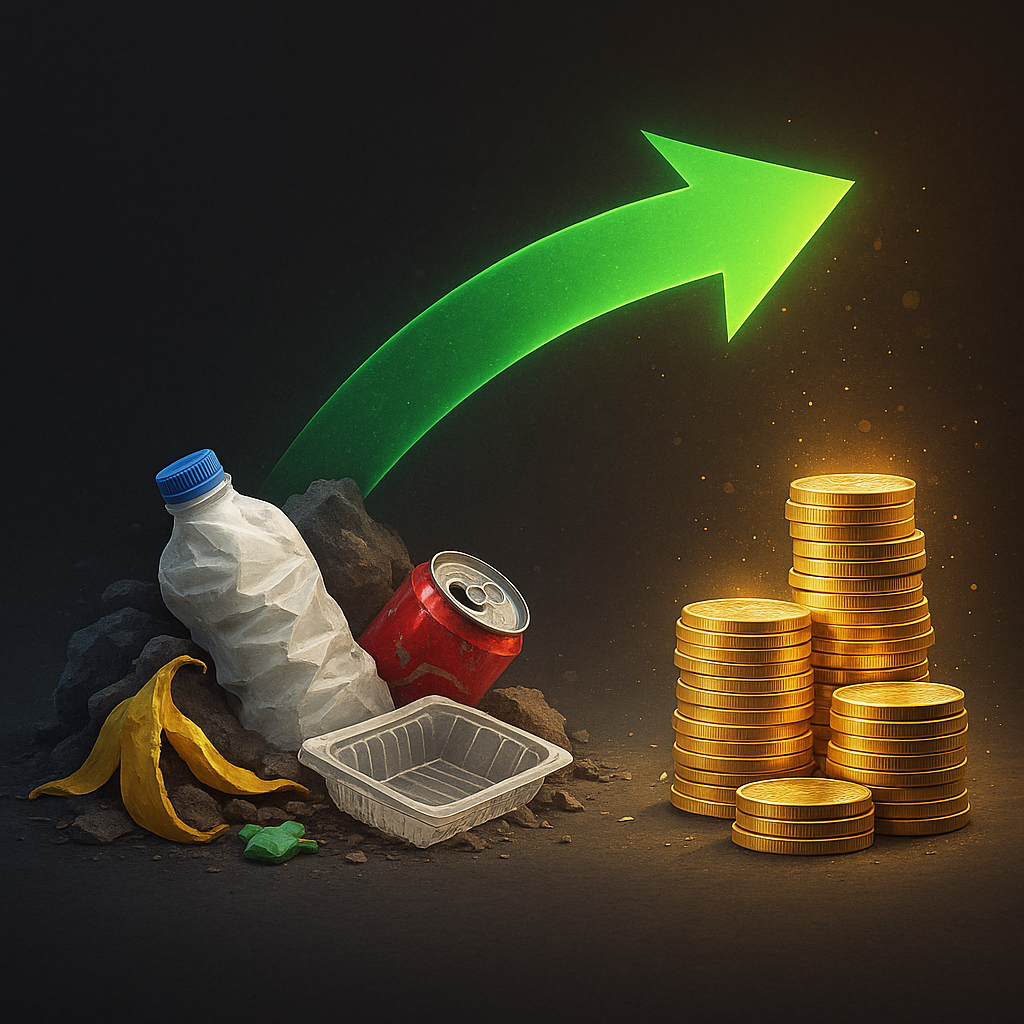
Material Recovery Facilities (MRFs) are designed to extract value from mixed recyclables, but even the most efficient operations generate residue. The valuable material that escapes recovery is typically sent to landfills or incineration. This residue represents a double burden: disposal costs and lost revenue from recyclables left behind. However, by reprocessing this residue, MRFs can transform a cost center into a profit opportunity while reducing their disposal burdens.
Is Residue Reprocessing Financially Viable?
The key question we aim to answer is: Is it financially viable for an MRF to reprocess its residue output?
To determine this, we need to evaluate both the potential revenue from recovering additional recyclables and the operational costs (OPEX) of reprocessing the residue. This analysis will help MRF operators make informed decisions about whether residue reprocessing is a worthwhile action to consider.
Simulating the Sorting Process
To answer this question, we used our proprietary mass-balance modeling application, SortFlow Process, to simulate the MRF’s operations under different scenarios.
The sorting process of the modeled MRF (Materials Recovery Facility) in this study is divided into multiple stages, each designed to recover specific materials and minimize residue. The stages are as follows:
- Manual Pre-Sorting: In this initial stage, manual pickers remove plastic film and oversized items to prevent equipment malfunctions and ensure smooth operation.
- OCC Recovery: This stage uses an OCC (Old Corrugated Cardboard) screen to separate large cardboard materials.
- Glass Recovery: Glass is first separated using a glass-breaking screen. A secondary opportunity for glass recovery occurs at the ballistic separator. The glass collected from both the glass-breaking screen and the ballistic separator is further cleaned using a zig-zag separator.
- Ballistic Separation: A ballistic separator performs a 2D/3D separation of materials, dividing flat, lightweight items (e.g., paper and film) from rigid, three-dimensional objects (e.g., bottles and cans).
- Metal Recovery:
- Ferrous Metals: Extracted using an overband magnet.
- Non-Ferrous Metals (e.g., Aluminum): Recovered through an Eddy Current Separator (ECS).
- Near-Infrared (NIR) Optical Sorting to target specific polymers and fibers:
- NIR 1: Targets PET (Polyethylene Terephthalate).
- NIR 2: Focuses on HDPE (High-Density Polyethylene).
- NIR 3: Separates mixed plastics.
- NIR 4: Identifies and recovers paper.
Final Recovery (NIR 5): Positioned at the end of the process, NIR 5 captures recyclables missed by earlier machines. These recovered materials are reintroduced into the process at the ballistic separator stage. The negative fraction from NIR 5 represents the primary residue output of the plant.
MRF Process Flow Diagramme

The methodology uses 3 models:
- Simulating Normal Operations (Model 1):
- This step establishes the quantity and quality of residue produced during standard operations. It provides a baseline for comparison.
- Simulating Residue Reprocessing (Models 2 and 3):
- In Model 2, we determine the maximum processing capacity of the plant for residue material.
- In Model 3, we calculate the number of hours required to process the residue at this capacity and estimate the associated OPEX.
Finally, we compare the financial outcomes of reprocessing residue versus sending it directly to disposal.
Assumptions: A Typical MRF in Action
Our model represents a typical MRF in the UK with a processing capacity of 18 tonnes per hour (tph). The plant processes Dry Mixed Recyclables (DMR), a common input stream that consists of mixed paper (32.08%), glass (22.61%), and cardboard (7.34%) with plastics making up about 16% and metals around 6.5%. Contamination (10.29%), and fines (5%) are also present, showing a mix of valuable recyclables and low-value or costly fractions.
To ensure the analysis is realistic, we tuned the model to reflect expected sorting performance in real-life operations. This includes assumptions about staffing, power costs, and plant operation, which remain consistent across all scenarios.
Understanding Residue from Normal Operations (Model 1)
In Model 1, we simulate the processing of Dry Mixed Recyclables (DMR) at the plant’s full capacity of 18 tonnes per hour (tph). This analysis provides a detailed understanding of the residue generated, its composition, and its financial implications, while also accounting for the contamination present in the input material.
The residue yield from the process is 20.67%, meaning that for every tonne of input material, approximately 206.7 kilograms become residue. Over the course of a year, this amounts to 11,978 tonnes of material that is not recovered. However, it’s important to note that the input material itself contains a contamination level of 10.29%, which represents non-recyclable material present in the feedstock. This contamination naturally contributes to the residue yield, making it essential to evaluate the residue rate in the context of the recyclables present in the input.
The residue rate, calculated as the percentage of recyclables in the input material that end up in the residue stream, provides a more meaningful measure of sorting efficiency. In this case, the residue rate is 9.49%, indicating that nearly 10% of the recyclables fed into the process are lost to the residue stream. This highlights an opportunity to improve recovery rates and reduce the loss of valuable materials.
A closer examination of the residue composition reveals that 37.7% consists of valuable recyclables—such as PET, HDPE, aluminum, and fibers. These materials represent a significant opportunity for recovery that is currently being missed. The estimated value of this process inefficiency is approximately £322.05 per hour. This figure does not reflect a direct financial loss but rather serves as a performance indicator: it represents the difference between the value that could have been recovered from these materials had they been captured as output, versus the disposal cost incurred by the MRF due to their presence in the residue stream. As such, it provides a useful benchmark for assessing whether a particular residue stream may be worth reprocessing. On a broader scale, with disposal fees averaging £150 per tonne, the annual cost of managing the residue stream amounts to around £1.8 million. Together, these figures highlight not only the tangible financial burden of disposal, but also the unrealized value embedded in the residue—pointing to clear opportunities for improved recovery performance.
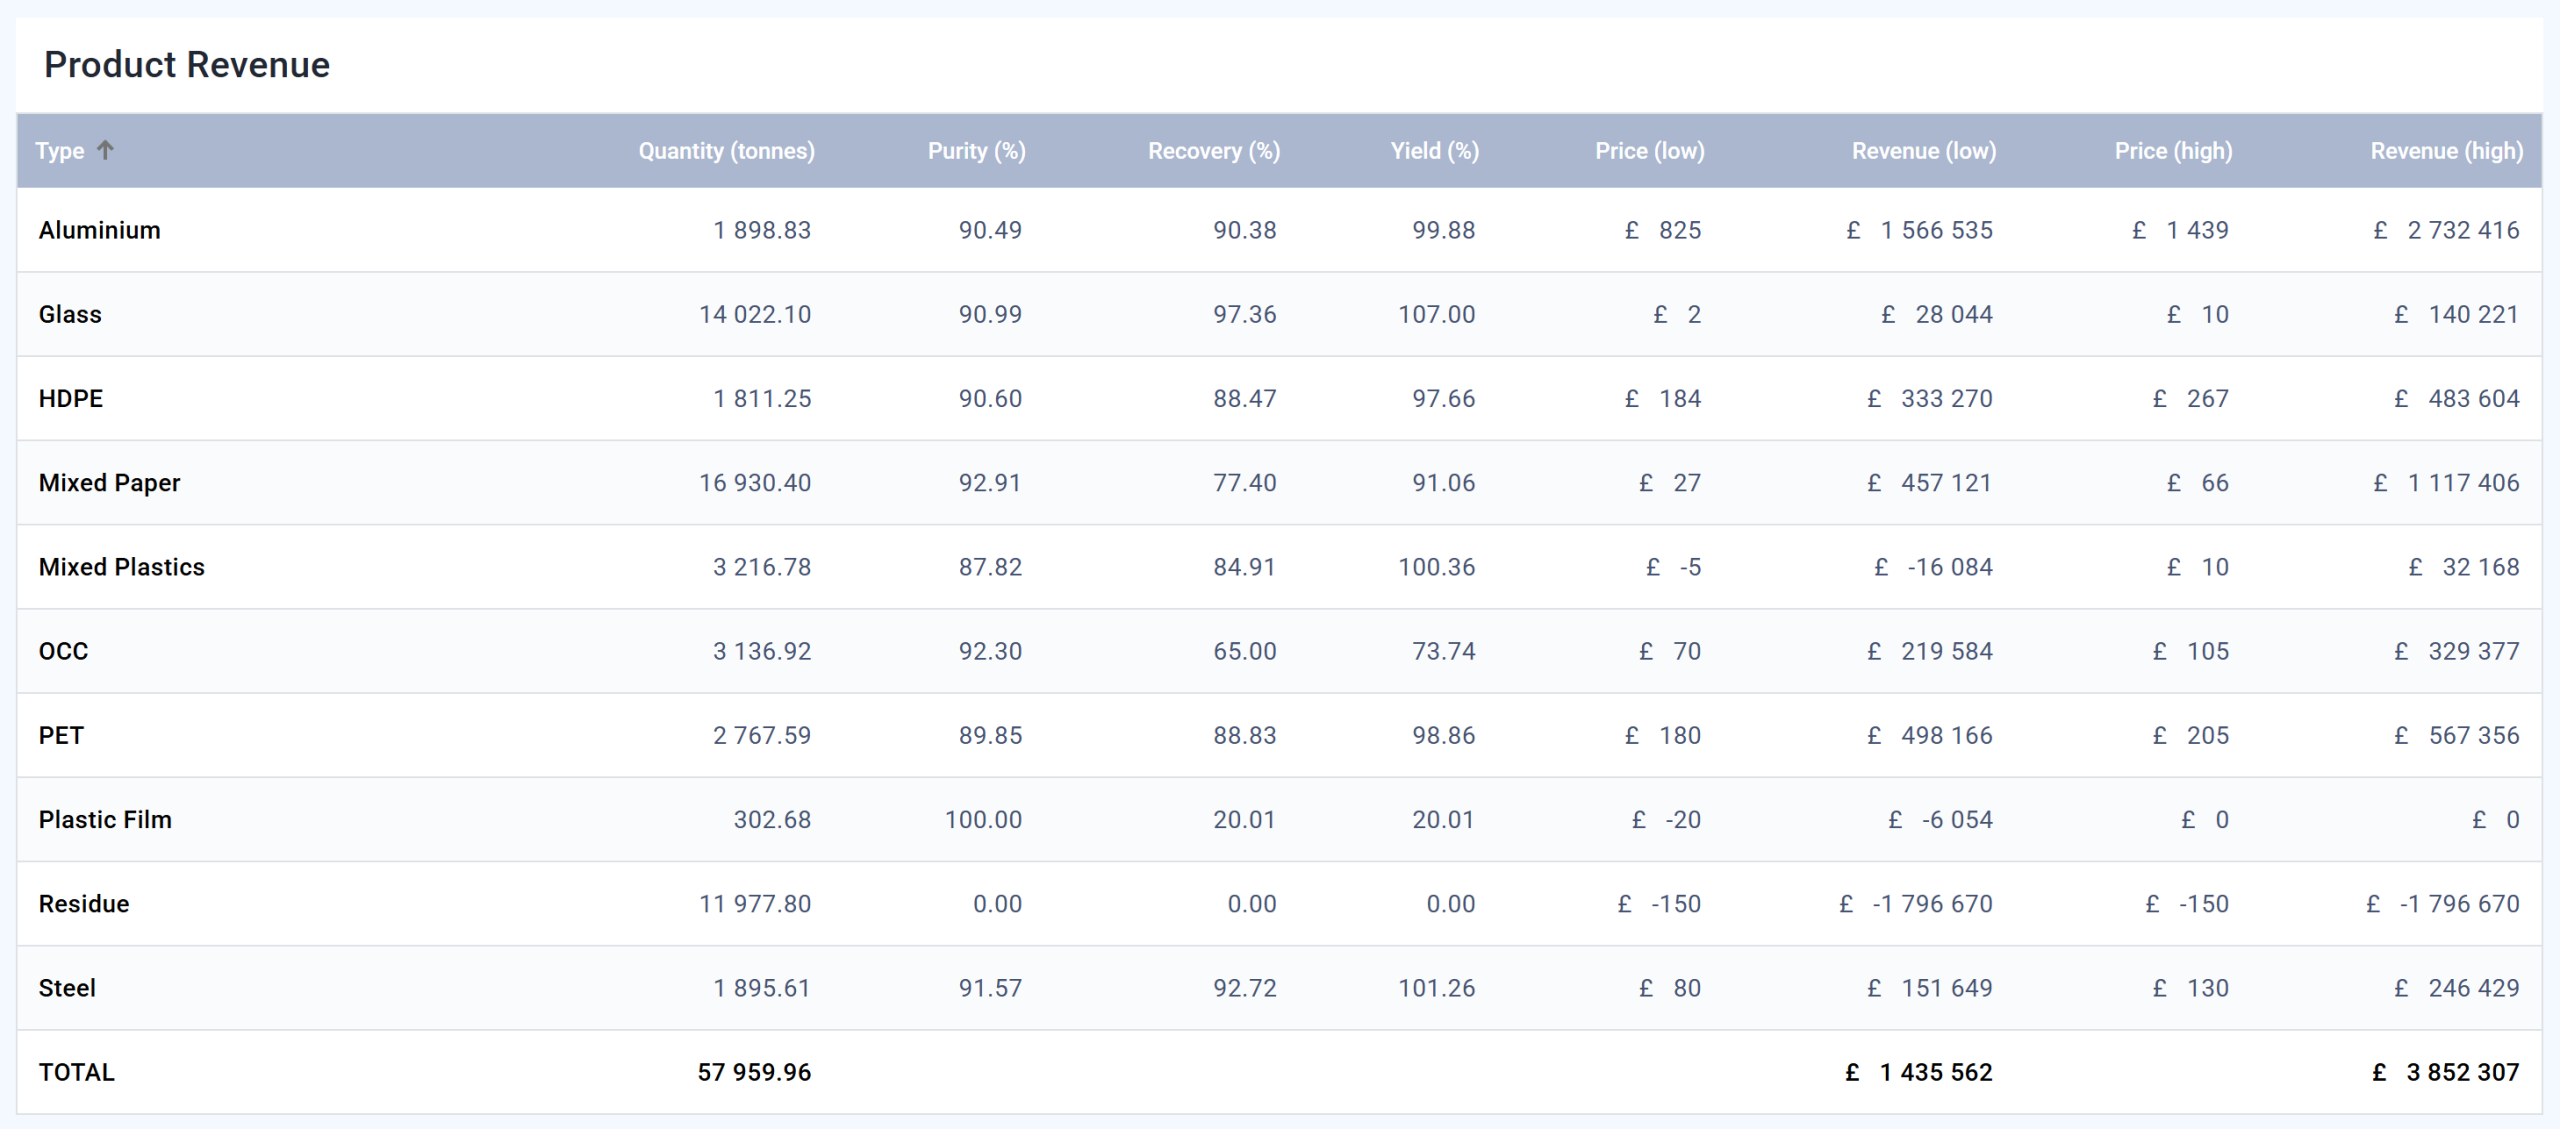
To put this into perspective, the MRF generates approximately £5.65 million in annual revenue from its product stream (excluding residue output), while incurring nearly £1.8 million in residue disposal costs. This residue includes both non-recyclable contaminants and valuable recyclables that were not recovered. The unrealised revenue from these trapped recyclables adds to the economic burden, with mixed paper and aluminum cans being the largest missed opportunities. Mixed paper alone represents £212.08 per hour in potential revenue, while aluminum cans contribute £44.10 per hour. Together, these factors highlight the dual challenge of residue: the high cost of disposal and the significant foregone revenue from unrecovered materials.
As shown in Figures 1 and 2, the residue not only represents a cost to the operation but also a missed opportunity to extract additional value. By addressing the inefficiencies in recovery and accounting for the contamination in the input material, the plant could significantly enhance both its financial performance and material recovery rates.
Figure 1: Model 1 Residue Output Analysis
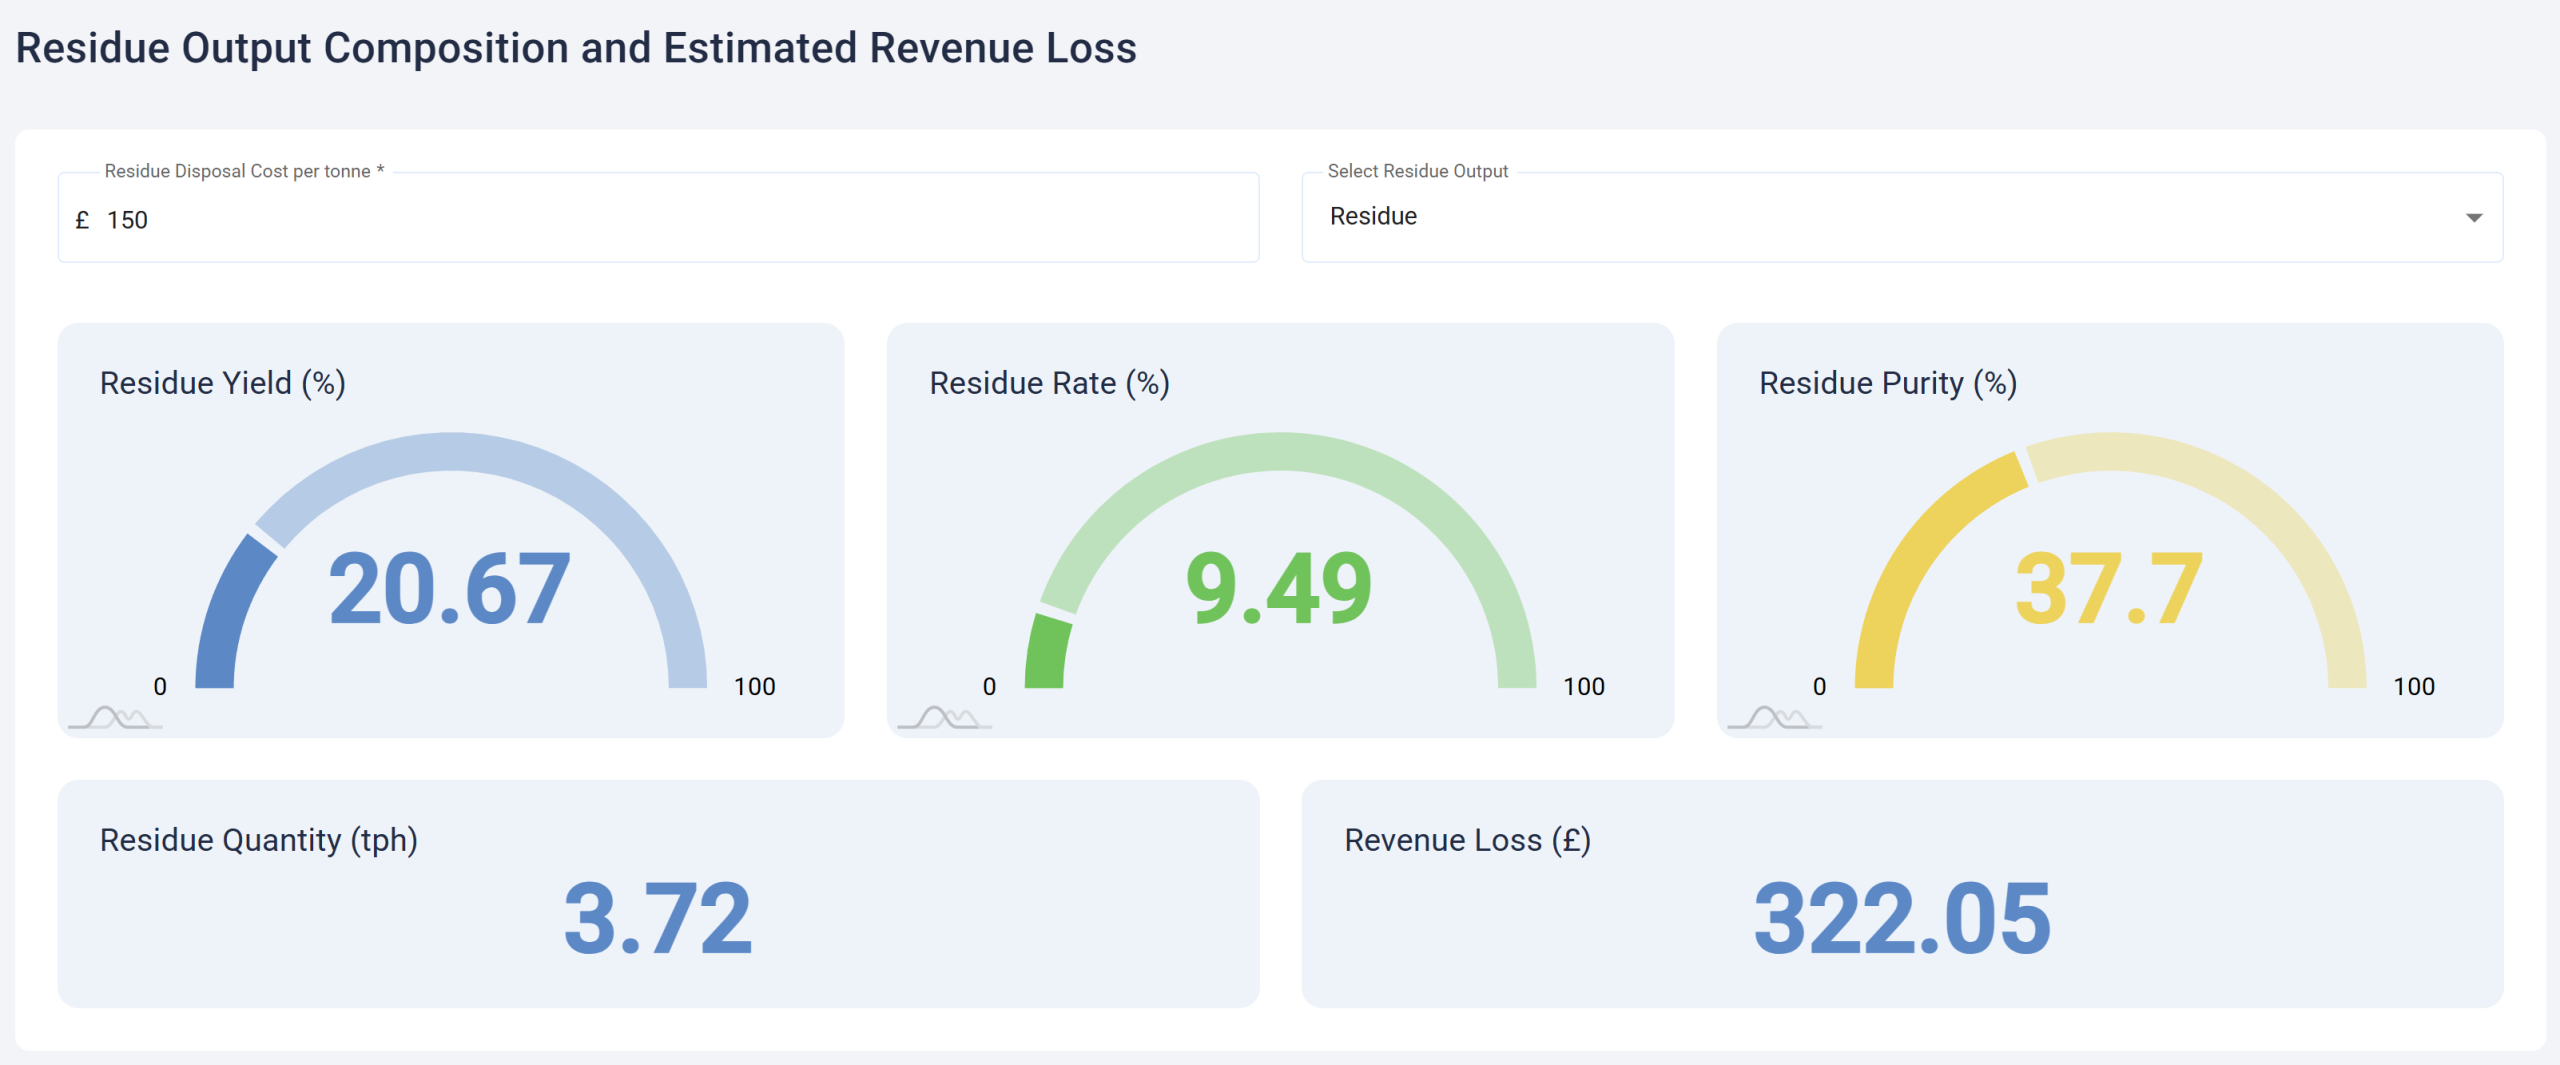
Figure 2: Model 1 Product Revenue
Finding the Plant’s Capacity for Residue (Model 2)
Residue material differs from DMR in composition, it contains less glass and more plastics and fibers, which affects the plant’s processing capacity. Using our capacity monitoring tool, we simulate the reprocessing of residue at the same throughput as DMR (18 tph). This “stress test” reveals that certain equipment, particularly the NIR sorters, operates over capacity.
For example, the NIR 5 recovery unit operates at 194% of its capacity and NIR 2 with 159%, making it clear that the plant cannot process residue at the same rate as DMR. The primary reason lies in the composition of the materials. DMR streams contain over 22.61% glass, whereas residue streams have only 1.8%. Glass is recovered early in the process, before the ballistic separators and NIR sorters, significantly reducing the material volume early on. Similarly, large OCC (Old Corrugated Cardboard) around 7.34% is also recovered early in DMR but is largely absent in residue, only about 0.91%. As a result, residue material does not experience the same reduction in volume during the initial mechanical processing stages.
Figure 3: Equipment Capacity Analysis
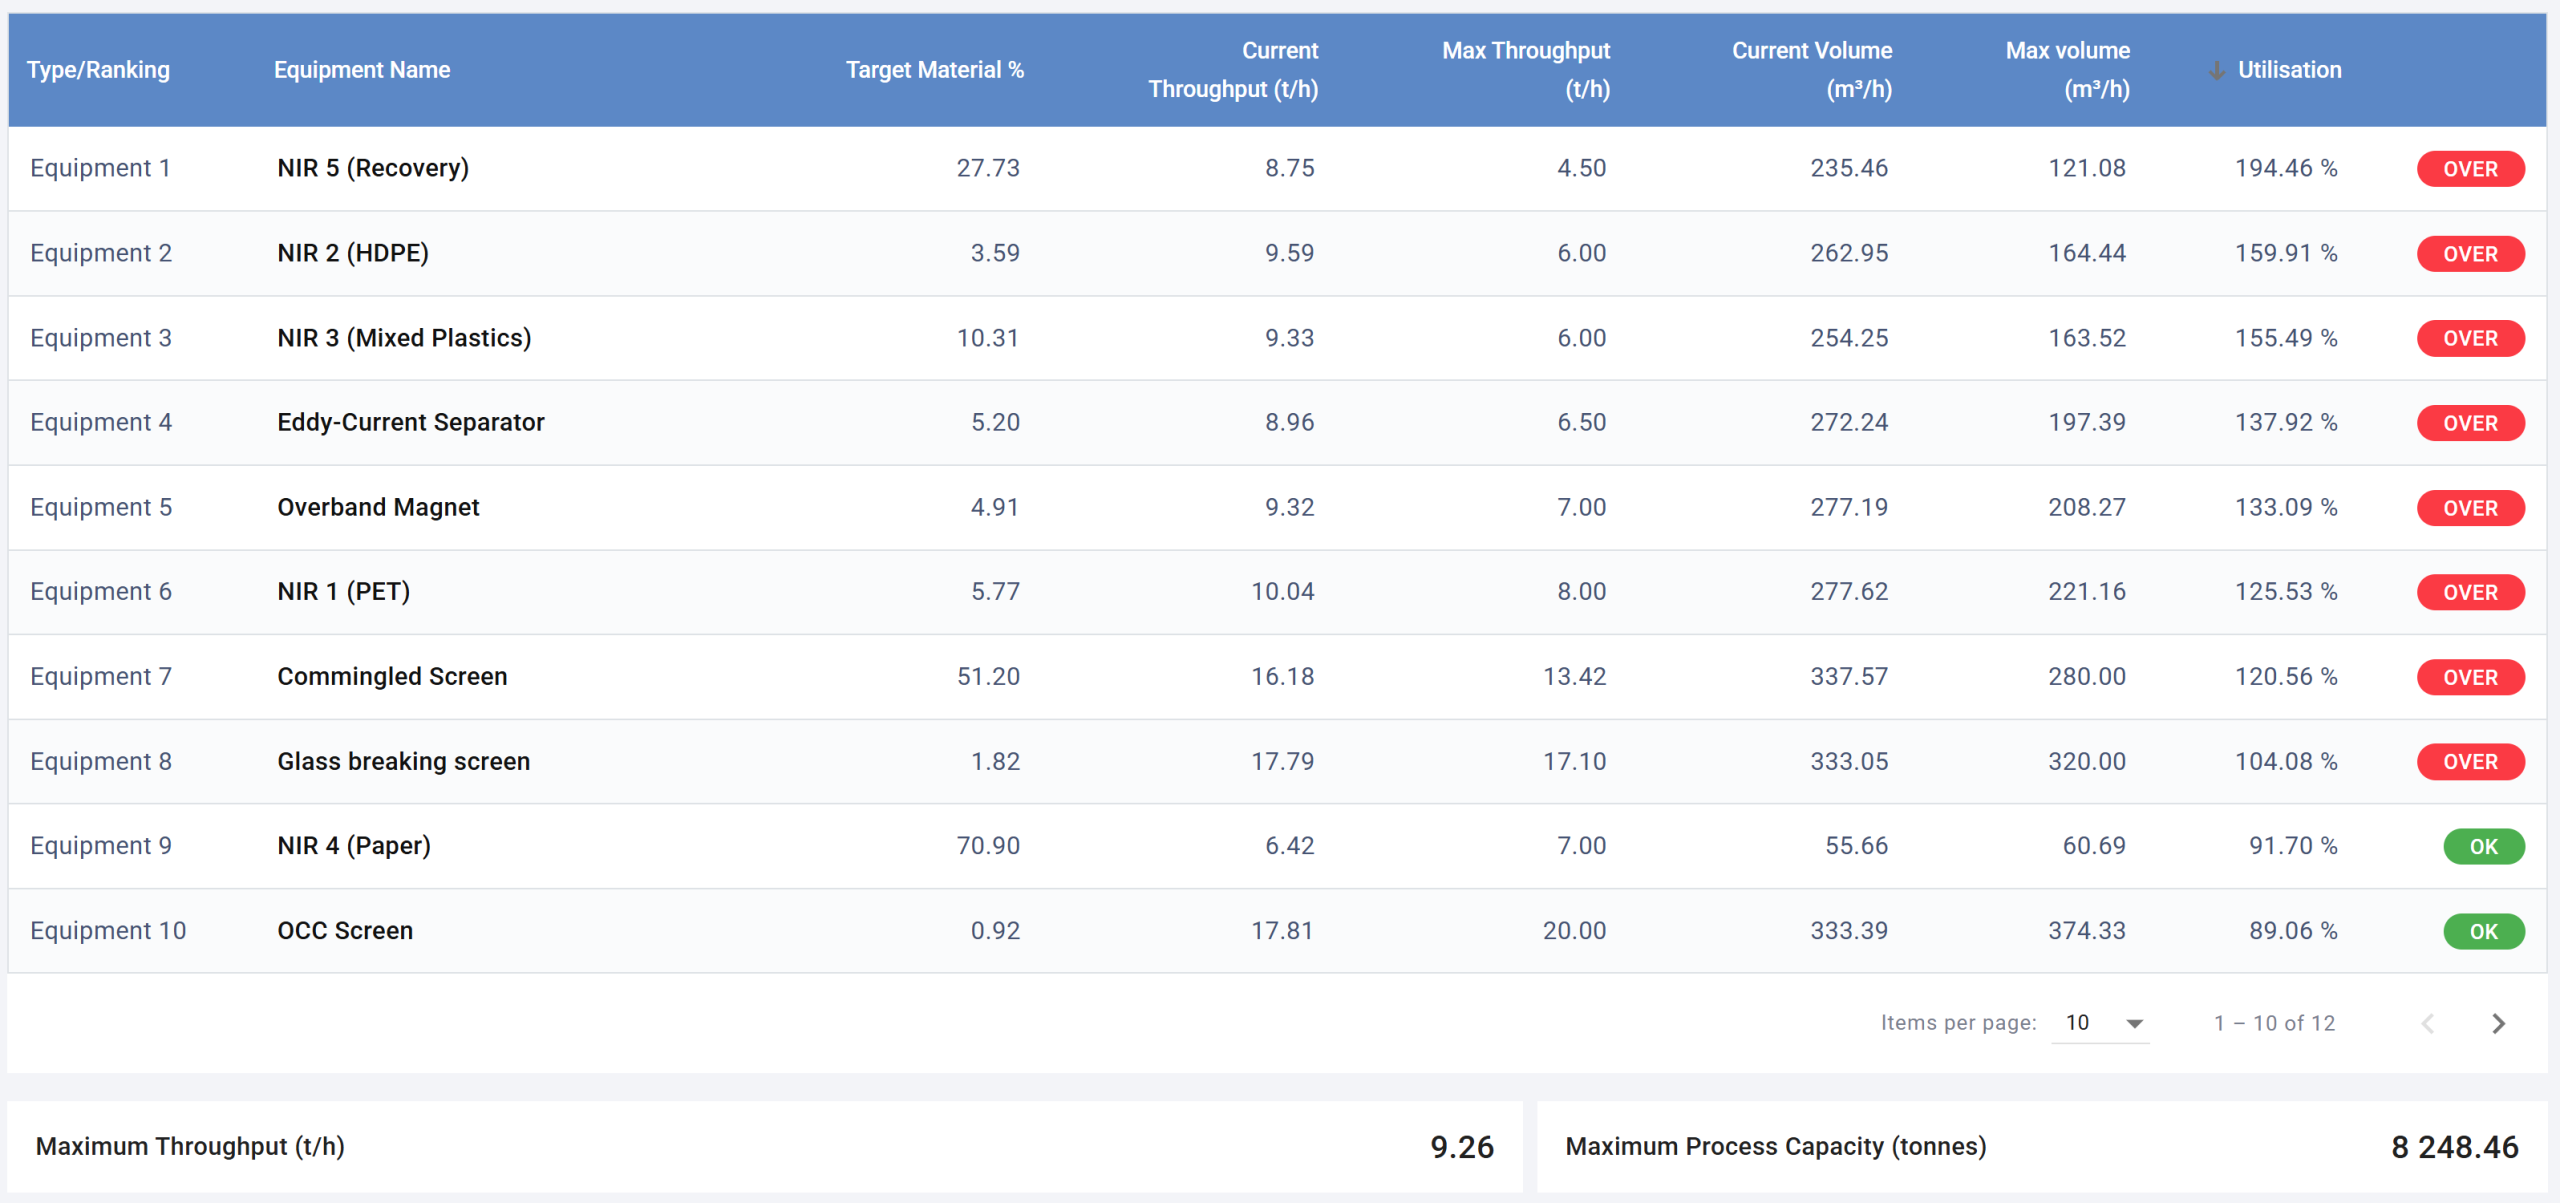
To prevent equipment bottlenecks and ensure smooth operations, we determined that the maximum processing capacity for residue is 9.25 tph, as shown in Figure 3, nearly half the capacity for DMR material. This reduced thought is critical for ensuring the plant operates within acceptable limits.
Residue Reprocessing: Operational Costs and Recovery Benefits (Model 3)
With the maximum throughput for residue established, we calculated the additional hours required to process the full 11,978 tonnes of residue annually. At a throughput of 9.25 tonnes per hour (tph), the plant would need to operate for an additional 1,295 hours to avoid overcapacity of equipment.
To ensure the model remains realistic, sorting performance was adjusted to account for reduced recovery efficiency. Recyclables missed during the first pass are often dirtier and harder to capture, so it’s reasonable to assume some will be missed again during reprocessing.
Key assumptions for calculating OPEX:
- Extra OPEX for reprocessing: ~£900/hour
- CAPEX: £0 (utilises existing equipment)
- Productive hours: 1,295 hours
The OPEX for residue reprocessing is calculated as:
- OPEX = £900/hour × 1,295 hours = £1,165,500 annually.
This figure includes staffing (at the same levels as normal operations), power consumption, and general operational costs.
The input stream contained approximately 50.65% recyclables (out of a total of 11,997.94 tonnes). Reprocessing enabled the recovery of 5,117.84 tonnes of valuable materials, generating additional revenue of £433,523. Mixed paper contributed the largest share, with 3,318.8 tonnes recovered, translating to savings of approximately £104.40 per hour. Following reprocessing, the residue purity decreased to 18% recyclables remaining, indicating that a significant portion of previously lost material was successfully captured.
In Model 1, the plant produced 11,997.94 tonnes of residue, resulting in an annual disposal cost of £1,796,670. In Model 3, after reprocessing, the residue volume decreased to 5,092.58 tonnes, reducing the associated disposal cost to £763,887 annually. This demonstrates that reprocessing not only improves material recovery but also significantly lowers disposal expenses.
To determine whether this strategy is financially justified, the full balance must be considered: the additional OPEX required for reprocessing (£1,165,500 annually), the revenue generated from recovered products (£433,523), and the savings from reduced disposal costs (£1,032,783). Only by evaluating these elements together can the net economic benefit of reprocessing be assessed.
Figure 4: Model 3 Residue Output Analysis
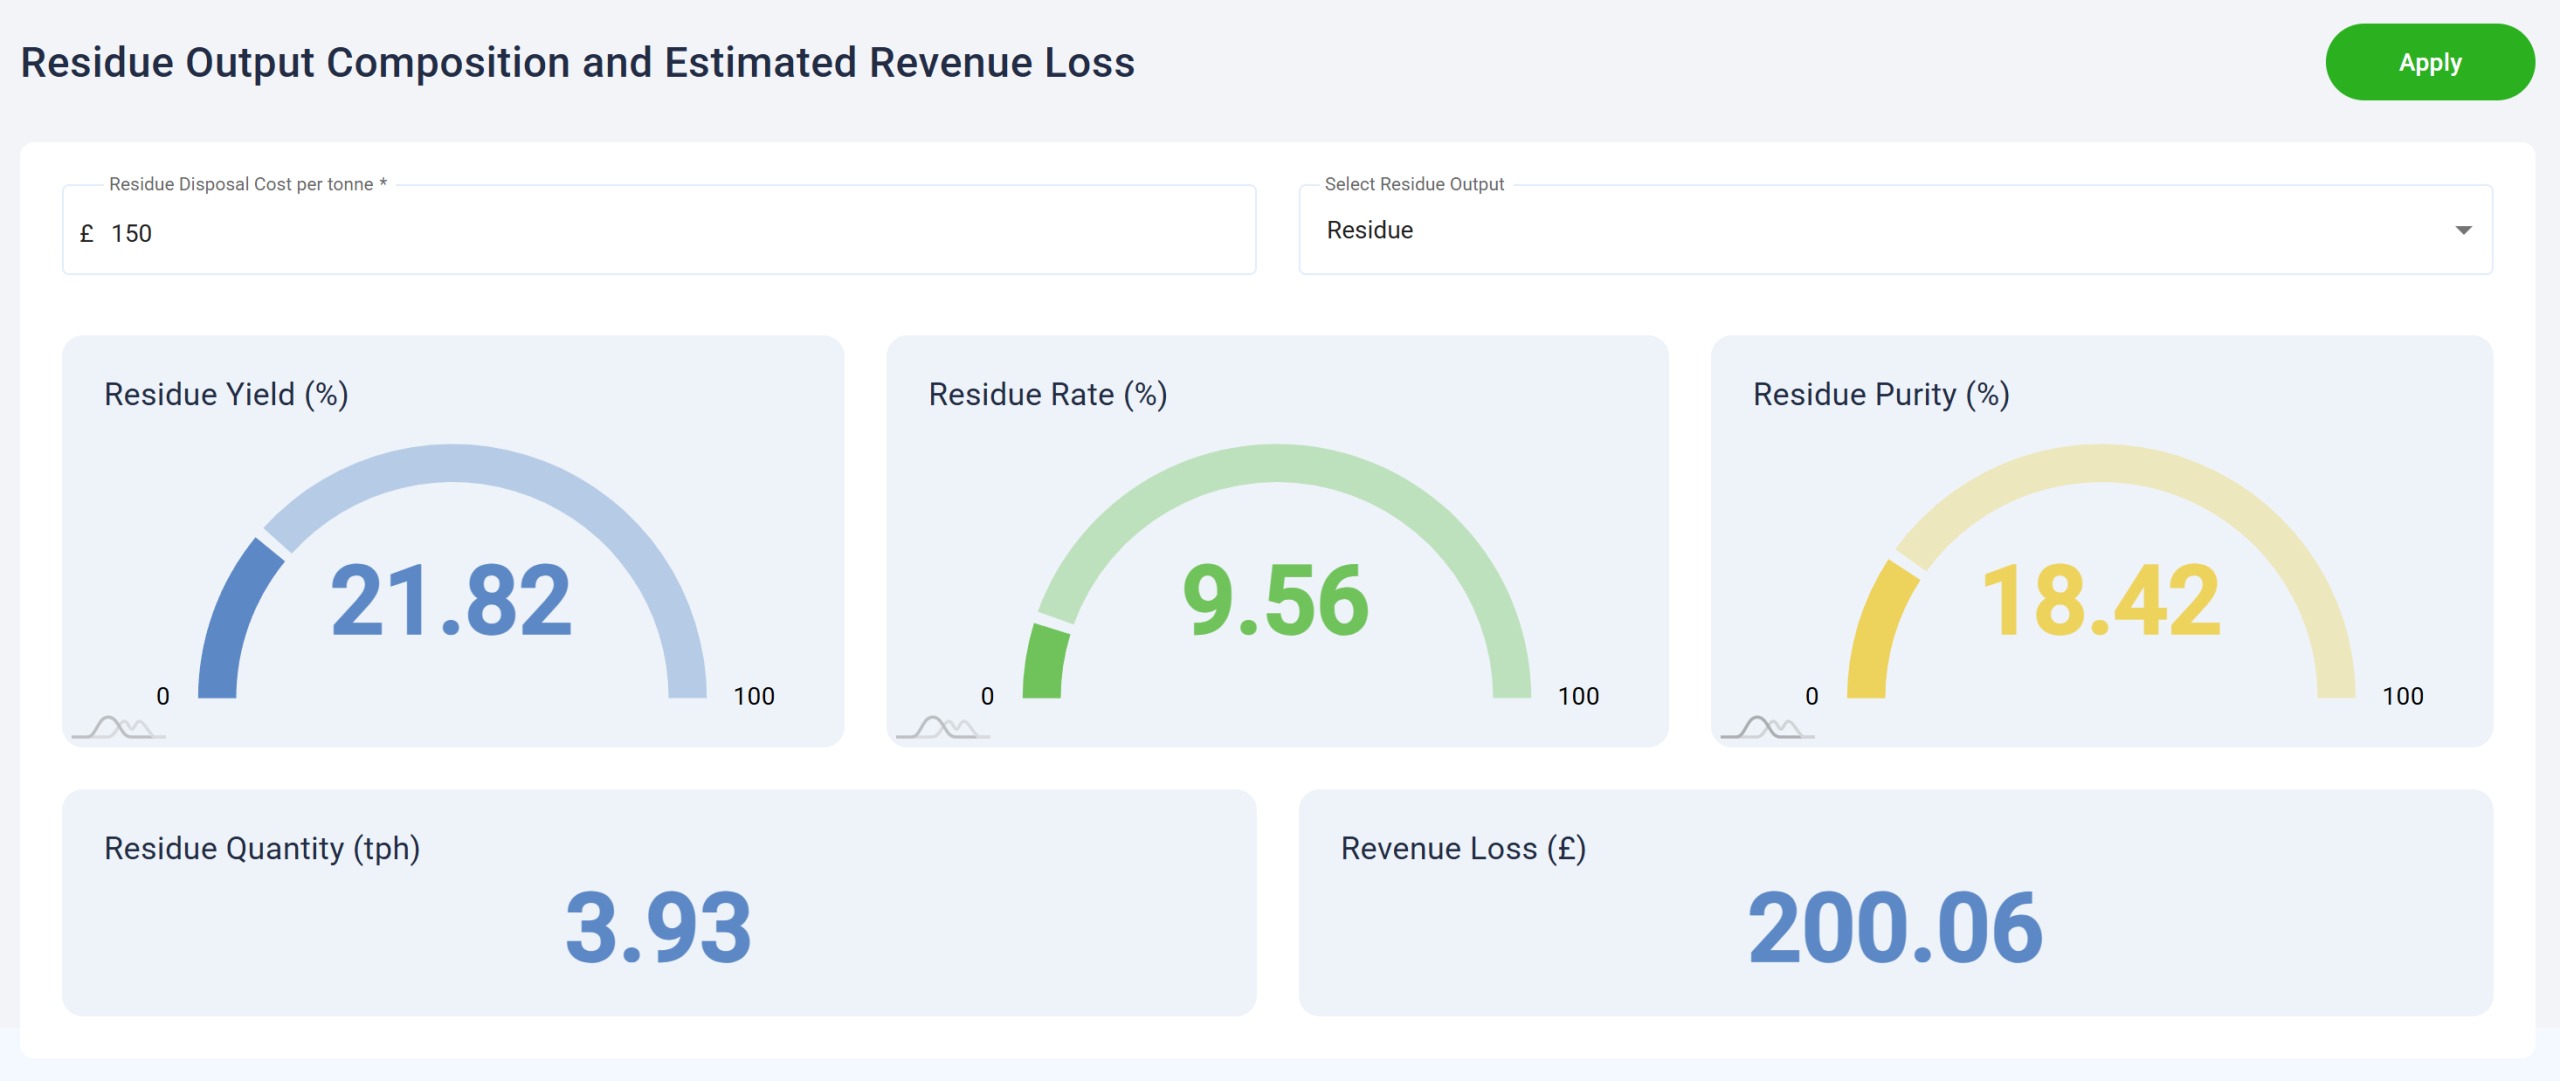
Figure 5: Model 3 Product Revenue

Results: Comparing Costs and Revenue
Reprocessing residue output does come with an operational cost, and in this case study, it is not a profit-generating activity on its own. The additional OPEX required for reprocessing (£1,165,500 annually) exceeds the revenue generated from recovered recyclables (£708,566). However, the key takeaway is that reprocessing significantly reduces the overall financial burden of residue management.
Without reprocessing (Model 1), the facility incurs an annual disposal cost of £1,796,670 to manage 11,978 tonnes of residue. By introducing reprocessing (Model 3), the residue volume is reduced to 5,092.58 tonnes, lowering the disposal cost to £763,887 annually. When combined with the revenue from recovered recyclables, the total cost of reprocessing (£1,220,821) is considerably lower than the baseline disposal cost in Model 1. This results in net savings of £575,849 per year.
In essence, reprocessing residue is a cost-reduction exercise rather than a direct profit-making strategy. It allows the facility to recover valuable materials, reduce the volume of waste requiring disposal, and ultimately lower the financial burden of residue management. Importantly, these savings are achieved without any additional capital investment, as the process utilises existing equipment.
This case study demonstrates that while reprocessing residue involves costs, it is a financially sound approach when compared to the alternative of disposing of the full residue stream. By turning a significant portion of waste into recoverable value, reprocessing not only improves the facility’s operational efficiency but also delivers substantial cost savings, making it a worthwhile strategy for optimising residue management.
A Framework for Reducing Residue Costs
This analysis demonstrates that residue reprocessing can significantly reduce the financial burden of waste processing by extracting value from recyclables that would otherwise be lost. While reprocessing is not a directly profitable exercise, it transforms residue management into a more cost-efficient process by lowering disposal expenses and recovering valuable materials.
By using mass-balance modeling and scenario analysis, MRF operators can assess the financial and operational feasibility of residue reprocessing in their facilities. The methodology outlined here—simulating normal operations (Model 1), stress testing residue reprocessing (Model 2), and optimising throughput (Model 3)—provides a replicable framework for minimising the costs associated with residue.
Although the specific figures will vary by plant and region, this approach is universally applicable, offering a practical strategy for improving the financial efficiency of residue management while capturing unrealised value from recyclable materials.
This analysis was conducted using SortFlow Process, our proprietary mass-balance modelling application. Price assumptions are based on market observations and may vary by region. Operators should verify local conditions before making investment decisions. The material prices are based on the average values over the last 6 months from letsrecycle.com.
Authors: Gunel Rahimli & Luc Mallinger
SortFlow Limited 2025
