
Is It Worth Adding PET Cleanup Sorting? A Financial Analysis for MRF Operators

Why does improving PET sorting matter?
Material Recovery Facilities (MRFs) play a crucial role in transforming mixed waste streams into valuable secondary materials. However, the profitability of MFR operations is increasingly challenged by volatile plastic prices and high operational costs. In particular, PET prices have experienced a significant decline over the last 18 months, squeezing the margins of many operators. As a result, plant managers must carefully evaluate whether investments in additional sorting equipment are justified. This article explores the effect of installing a Near‑Infrared (NIR) clean‑up stage to improve PET purity and quantifies its financial impact using a mass‑balance model.
The Current State of PET Recovery in MRFs
In a standard MRF, PET is recovered using an initial NIR sorter that separates bottles from the containers stream. Although this first sorting step captures a large portion of PET, the material still typically contains approximately 10-15% contaminants (e.g., residual HDPE and PP). Consequently, the product is typically sold at a lower price relative to high‑purity PET bales. One way to improve product quality is to add a second NIR sorter downstream of the primary PET extraction. This clean‑up stage will remove additional contaminants, thereby improving both purity and revenue potential.
Objective
The objective of this study is to compare a basic MRF configuration (one NIR unit only) with an improved configuration that includes a clean‑up step. Furthermore, quantifying the change in PET purity and saleable yield and calculating the return on investment (ROI) and payback period of adding the clean‑up unit are also evaluated. The sensitivity analysis are also demonstrated to determine the price and throughput thresholds at which investment becomes profitable.
Modeling the Investment: SortFlow Process Analysis
To evaluate this investment opportunity, we used SortFlow Process (www.sortflow.com), our proprietary mass-balance modeling application, to compare two scenarios based on real-world operational data:
- Scenario A (Baseline): Single NIR sorter achieving 86.70% PET purity
- Scenario B (Enhanced): Dual NIR system with cleanup stage achieving 96.95% PET purity
Key Model Inputs
Our analysis uses the following parameters derived from actual MRF operations:
- Annual PET throughput: 3,519.33 tonnes per year (4.83% of total 72,864.09 tonnes annual throughput)
- Operating hours: 4,048 hours annually
- PET processing rate: 0.86 tonnes per hour
- Capital expenditure: £500,000 (including £180,000 for equipment plus installation)
- Additional operating expenses: £28,906 annually (£20,000 maintenance + £8,906 energy costs for 10kW consumption
Price Assumptions and Regional Variations
Important Note: The price differentials used in this analysis are assumptions based on market observations and may vary significantly by region. Operators should verify local pricing before making investment decisions.
Our modelled price scenarios include:
- PET price scenarios for high purity output:
- Low: £325 /ton
- High: £350 /ton
- PET price scenarios for low purity output:
- Low: £170 /ton
- High: £195 /ton
These figures reflect the 2019-2024 period, but actual prices fluctuate based on local market conditions, end-user demand, and regional supply chains.
Financial Performance Comparison
PET Purity and Yield Improvements
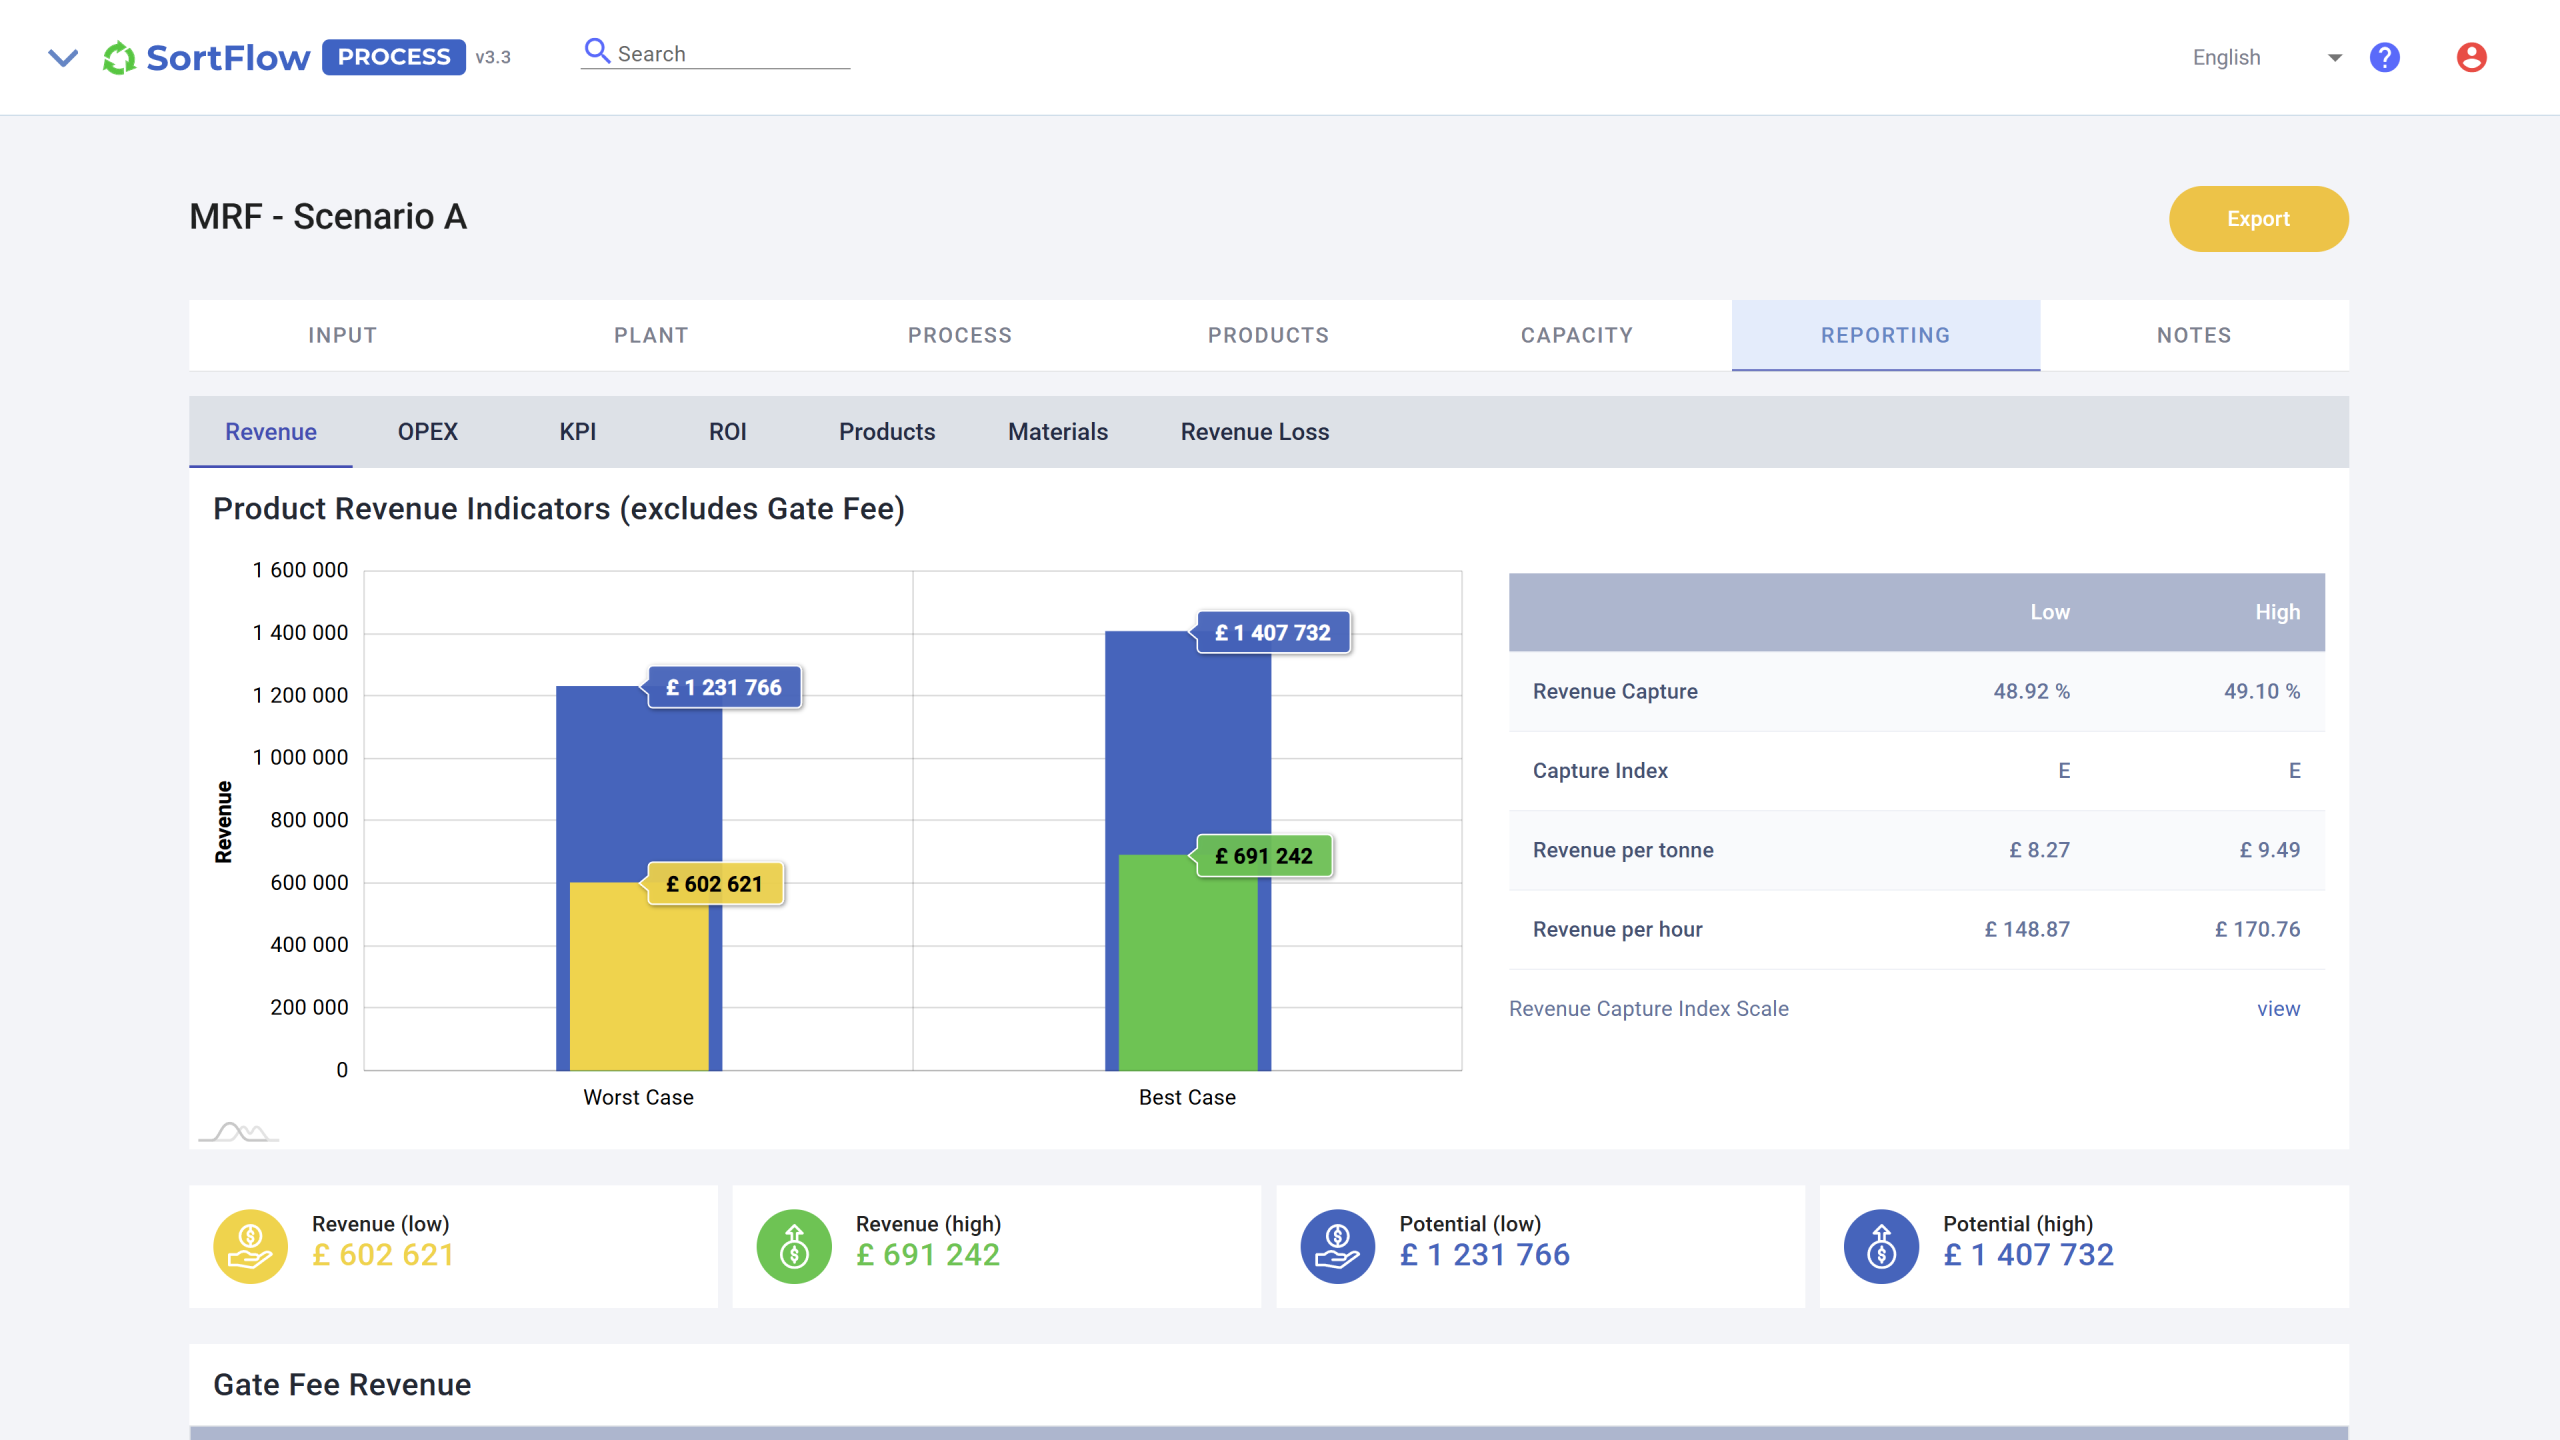
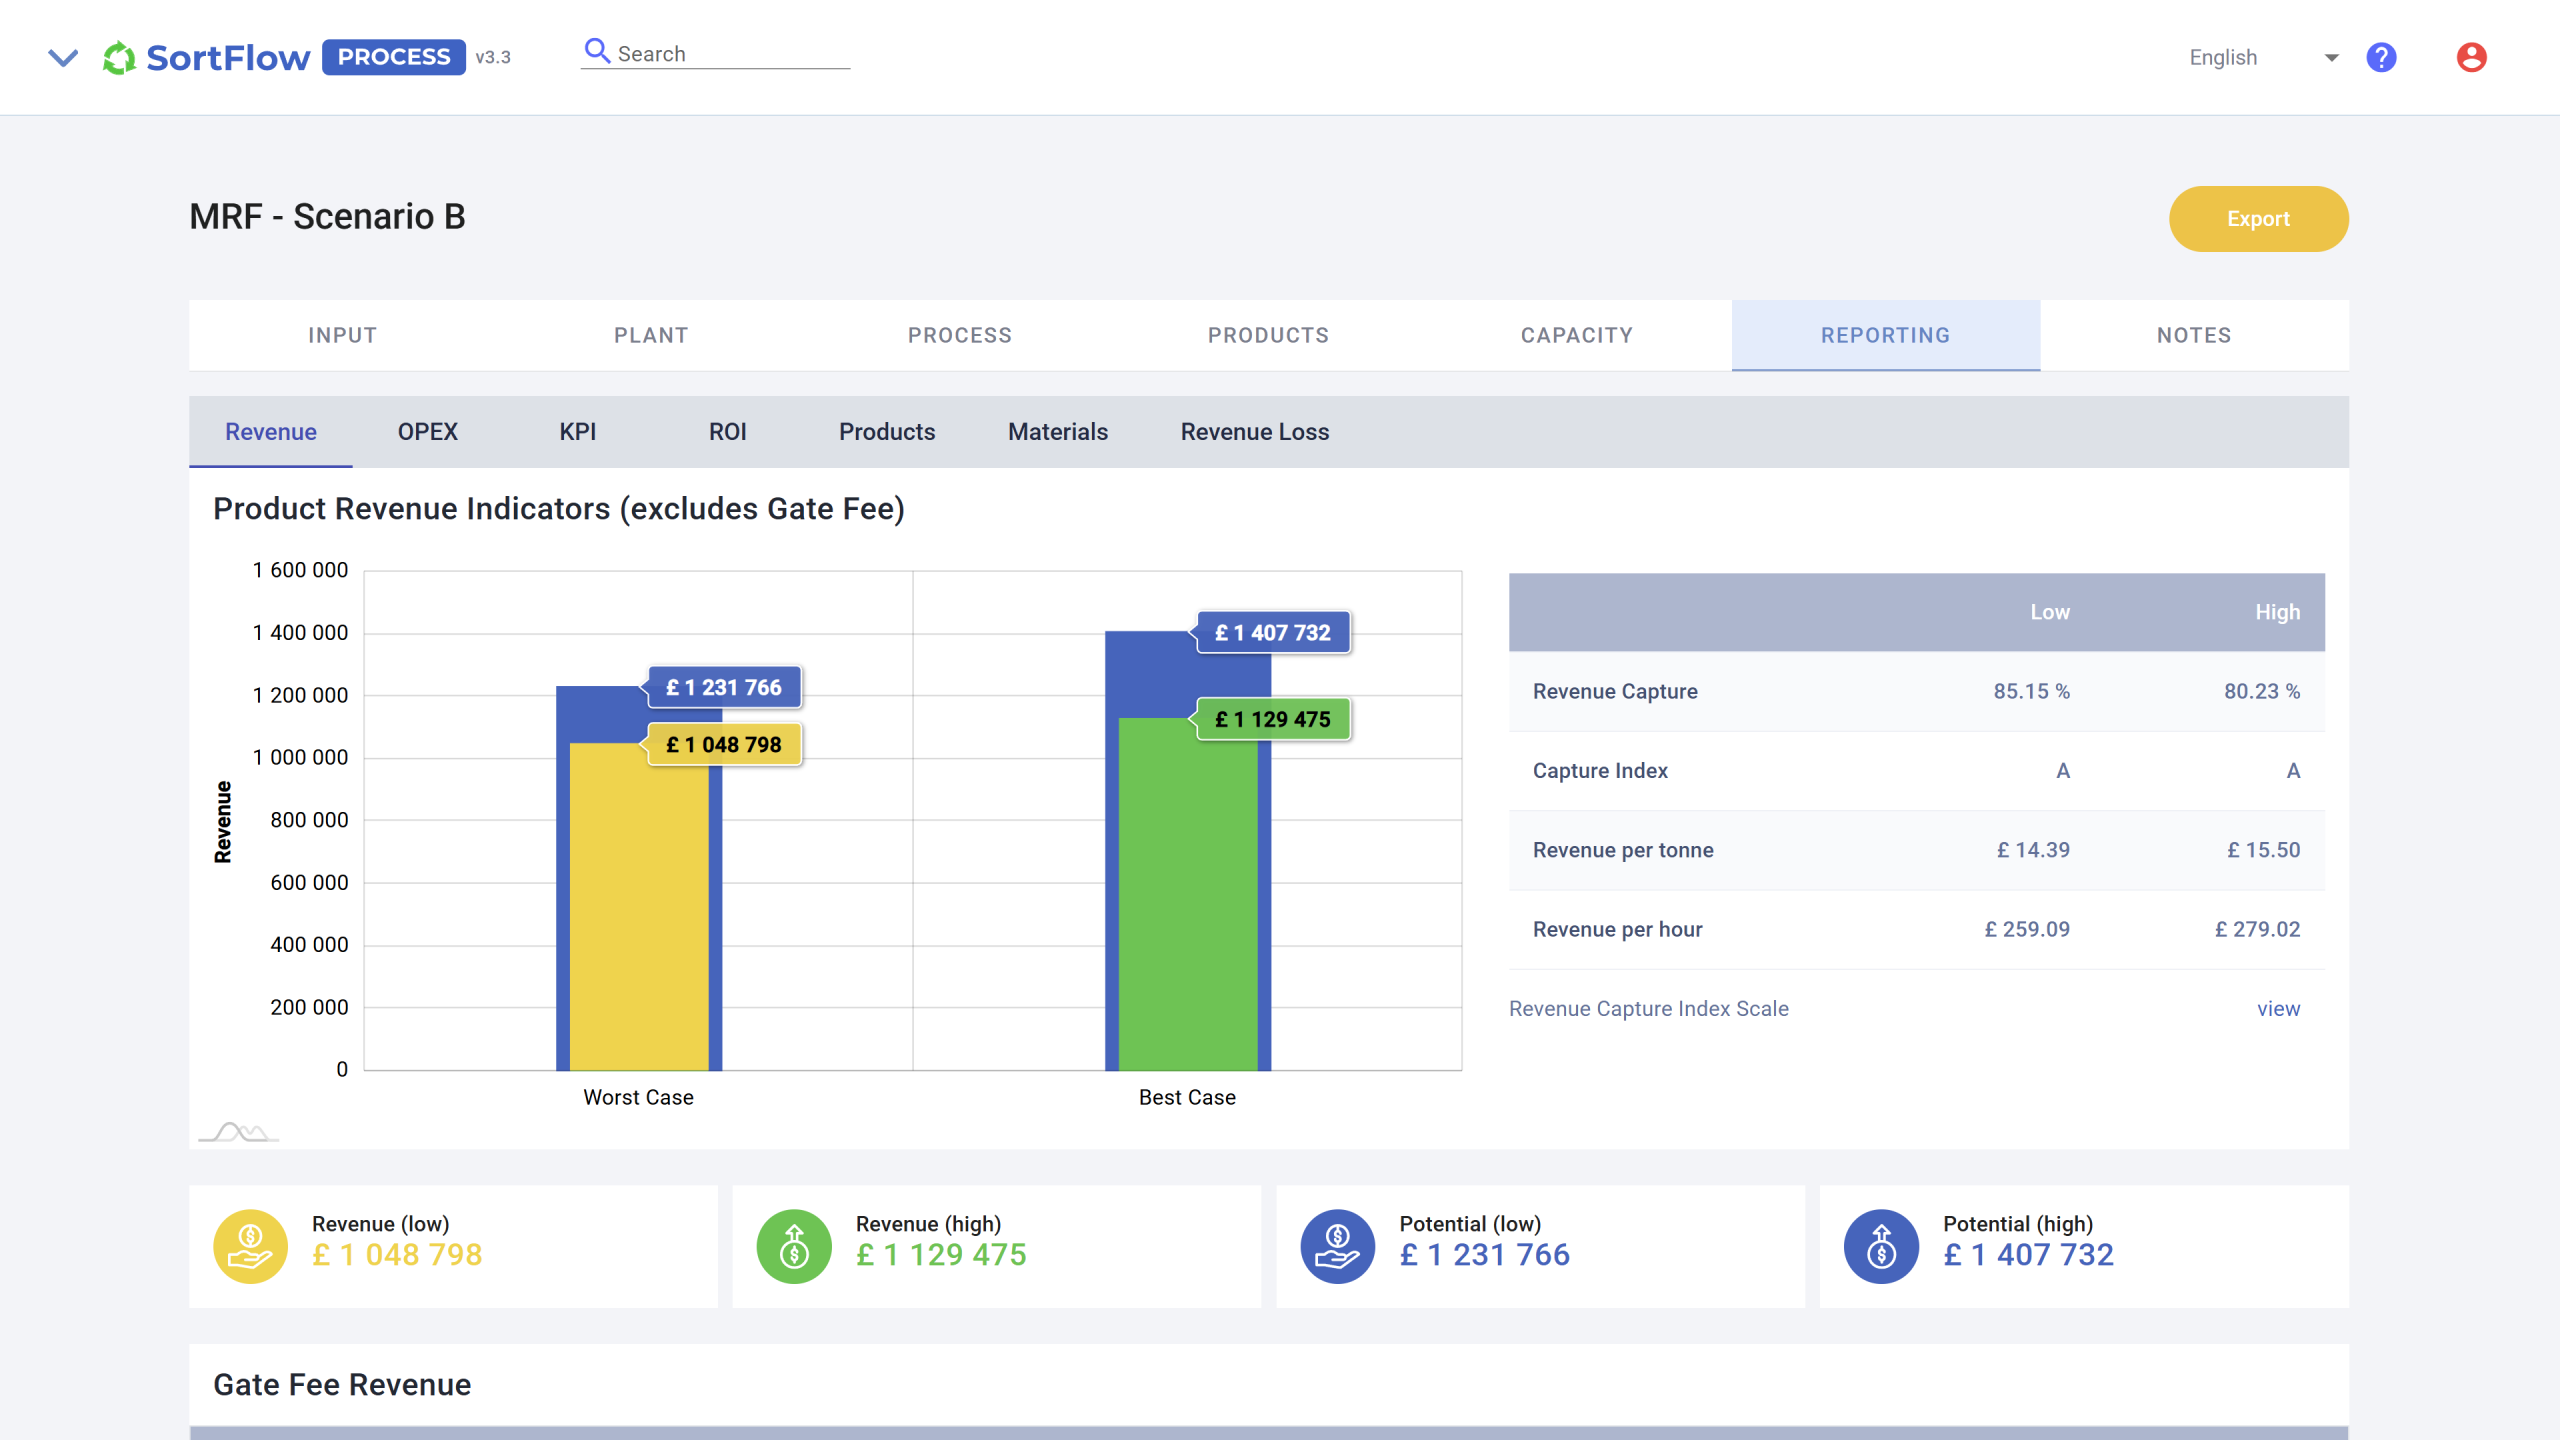
In the baseline scenario (Scenario A), the PET product has a purity of 86.70% which means that out of 3,535.93 tons are saleable. When the NIR cleanup is added (Scenario B), the purity increases to 96.95% of saleable PET. This represents a 10.25 % increase in saleable tonnage.
Scenario A:

Scenario B:
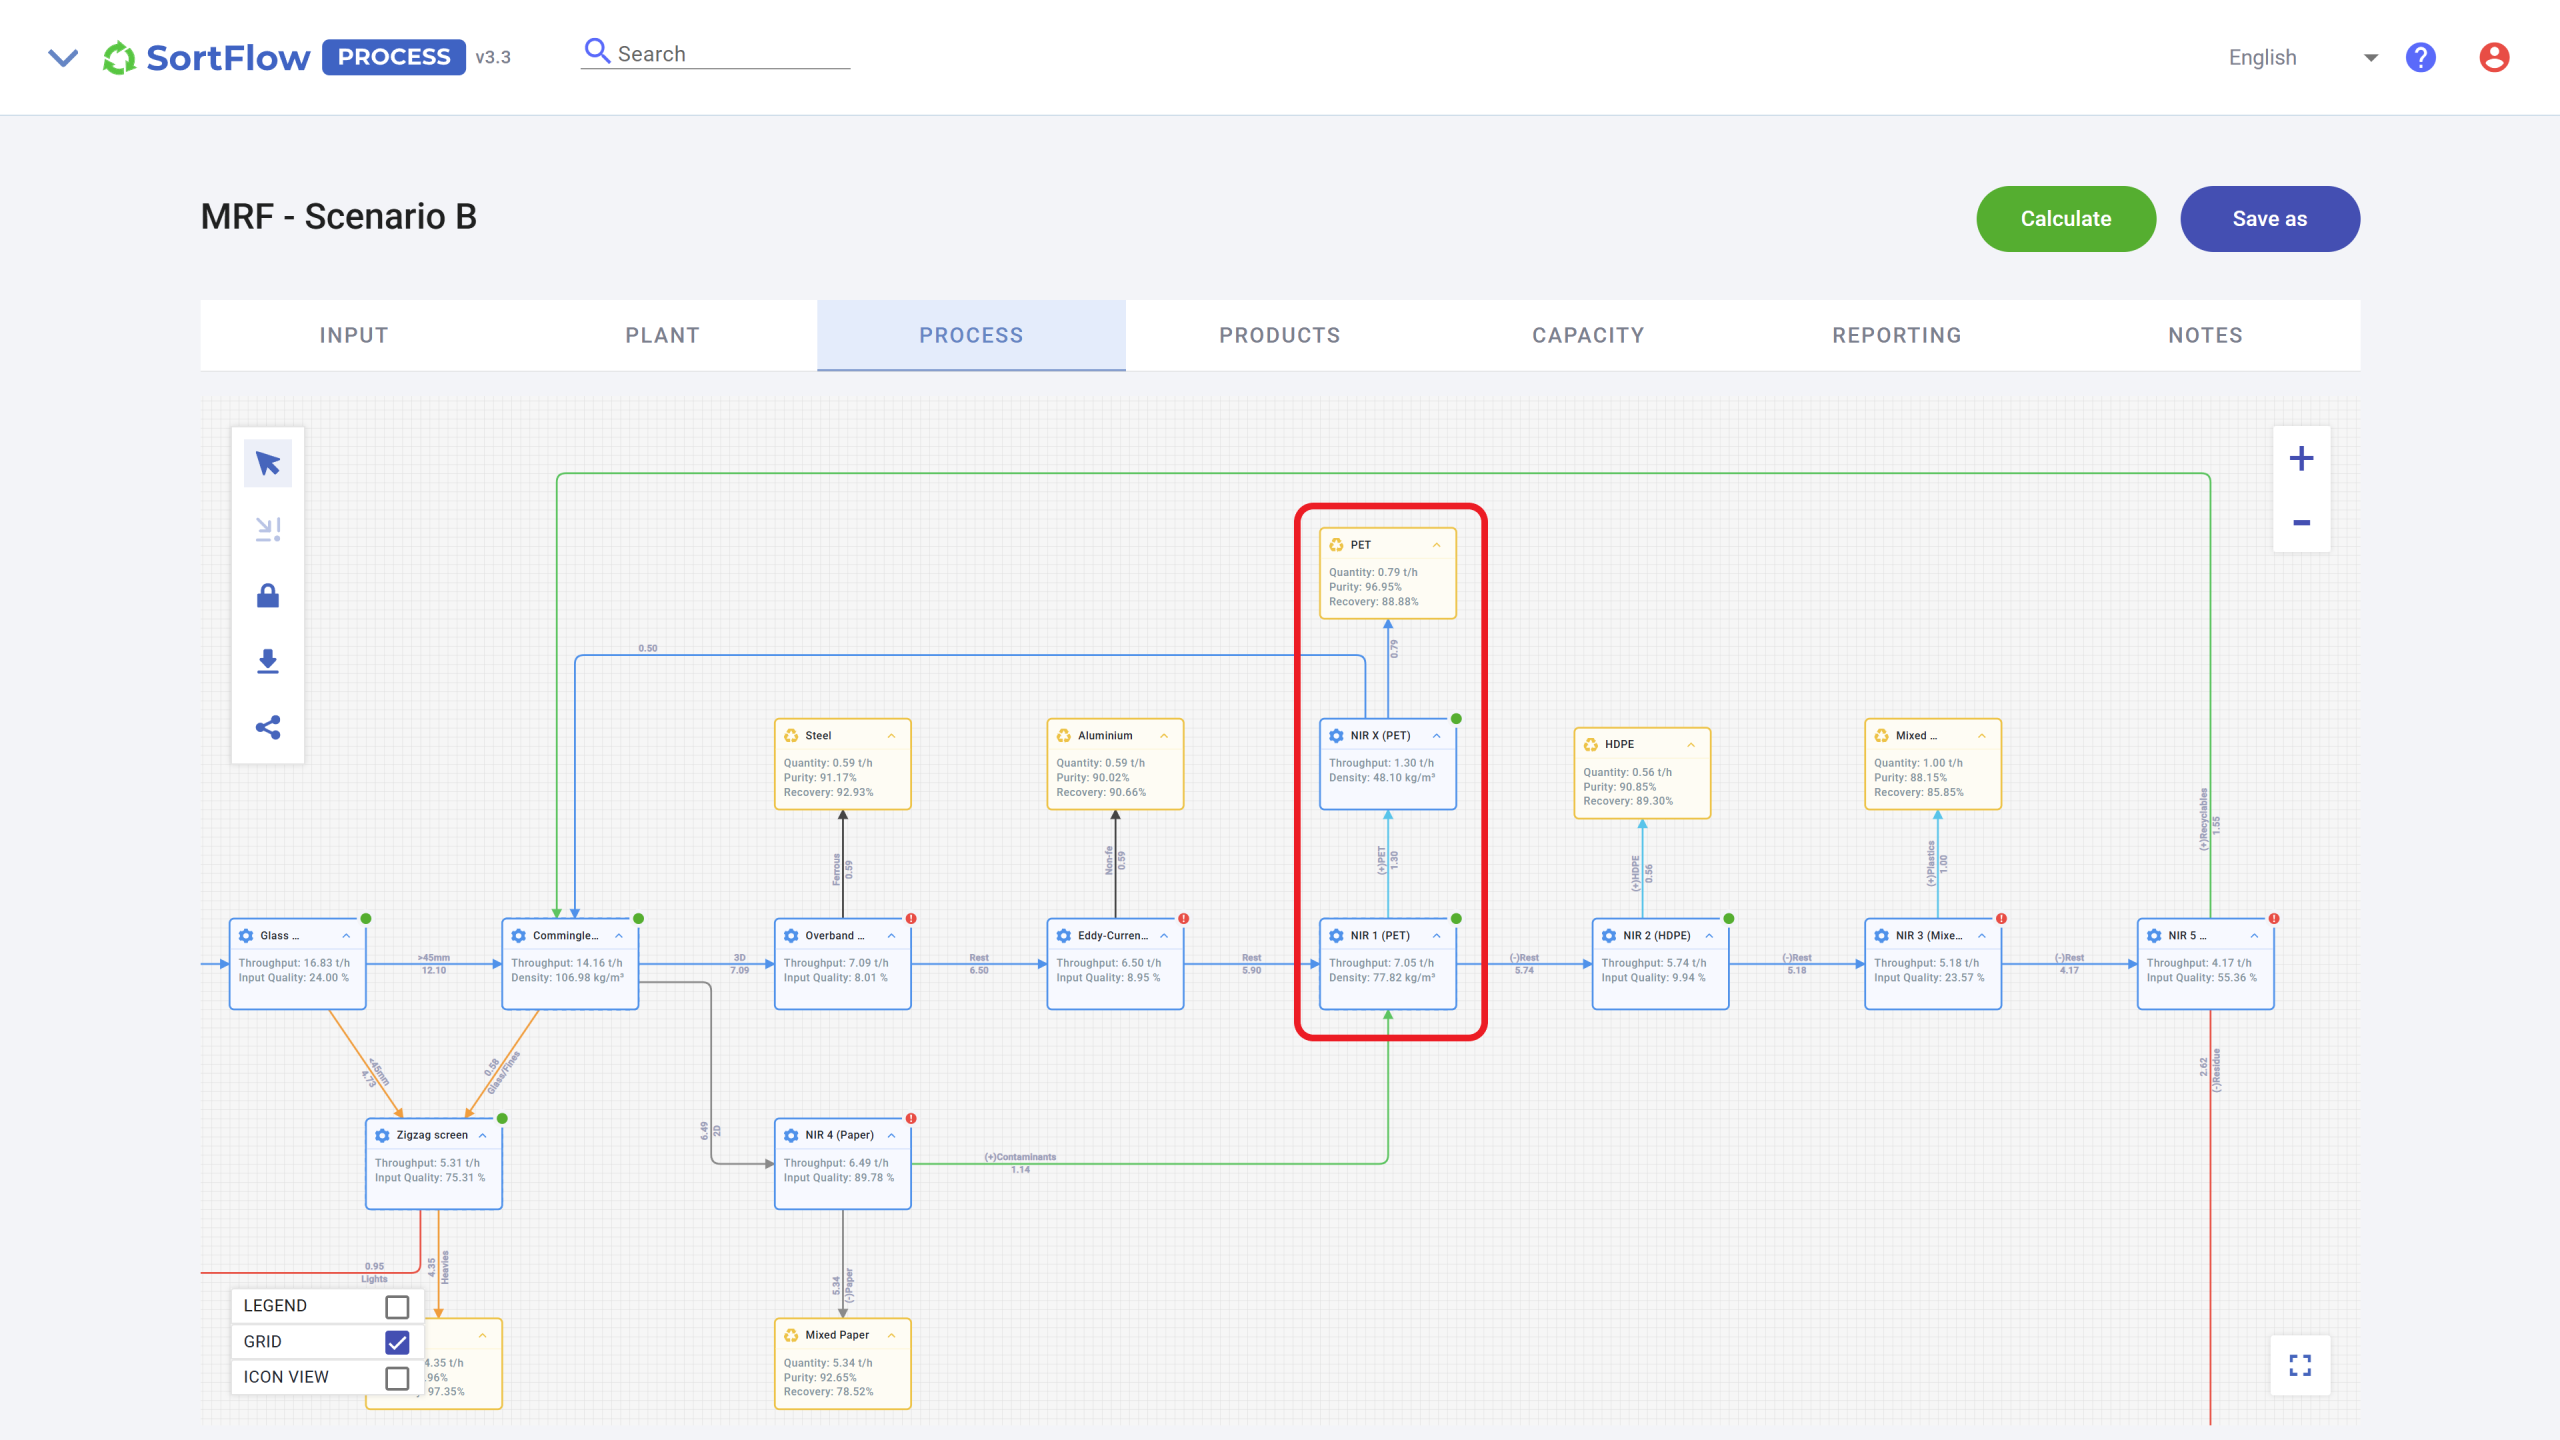
Financial Analysis of both scenarios are demonstrated in table:
| Scenario | Net Revenue (£) |
| A |
602,621 |
| B |
1,048,798 |
The annual net revenue improvement due to the higher purity is therefore £446,177. With a CAPEX of £500,000, the investment pays back slightly over latest 1.5 years as the
ROI: (446,177 – 28,905.6) / 500,000 = 0.834 (83.4%)
Payback Period: 500,000 / (446,177 – 28,905.6) = 1.19 years
These figures demonstrate attractive returns even under current depressed market conditions.
Sensitivity Analysis (PET Price and Throughput)
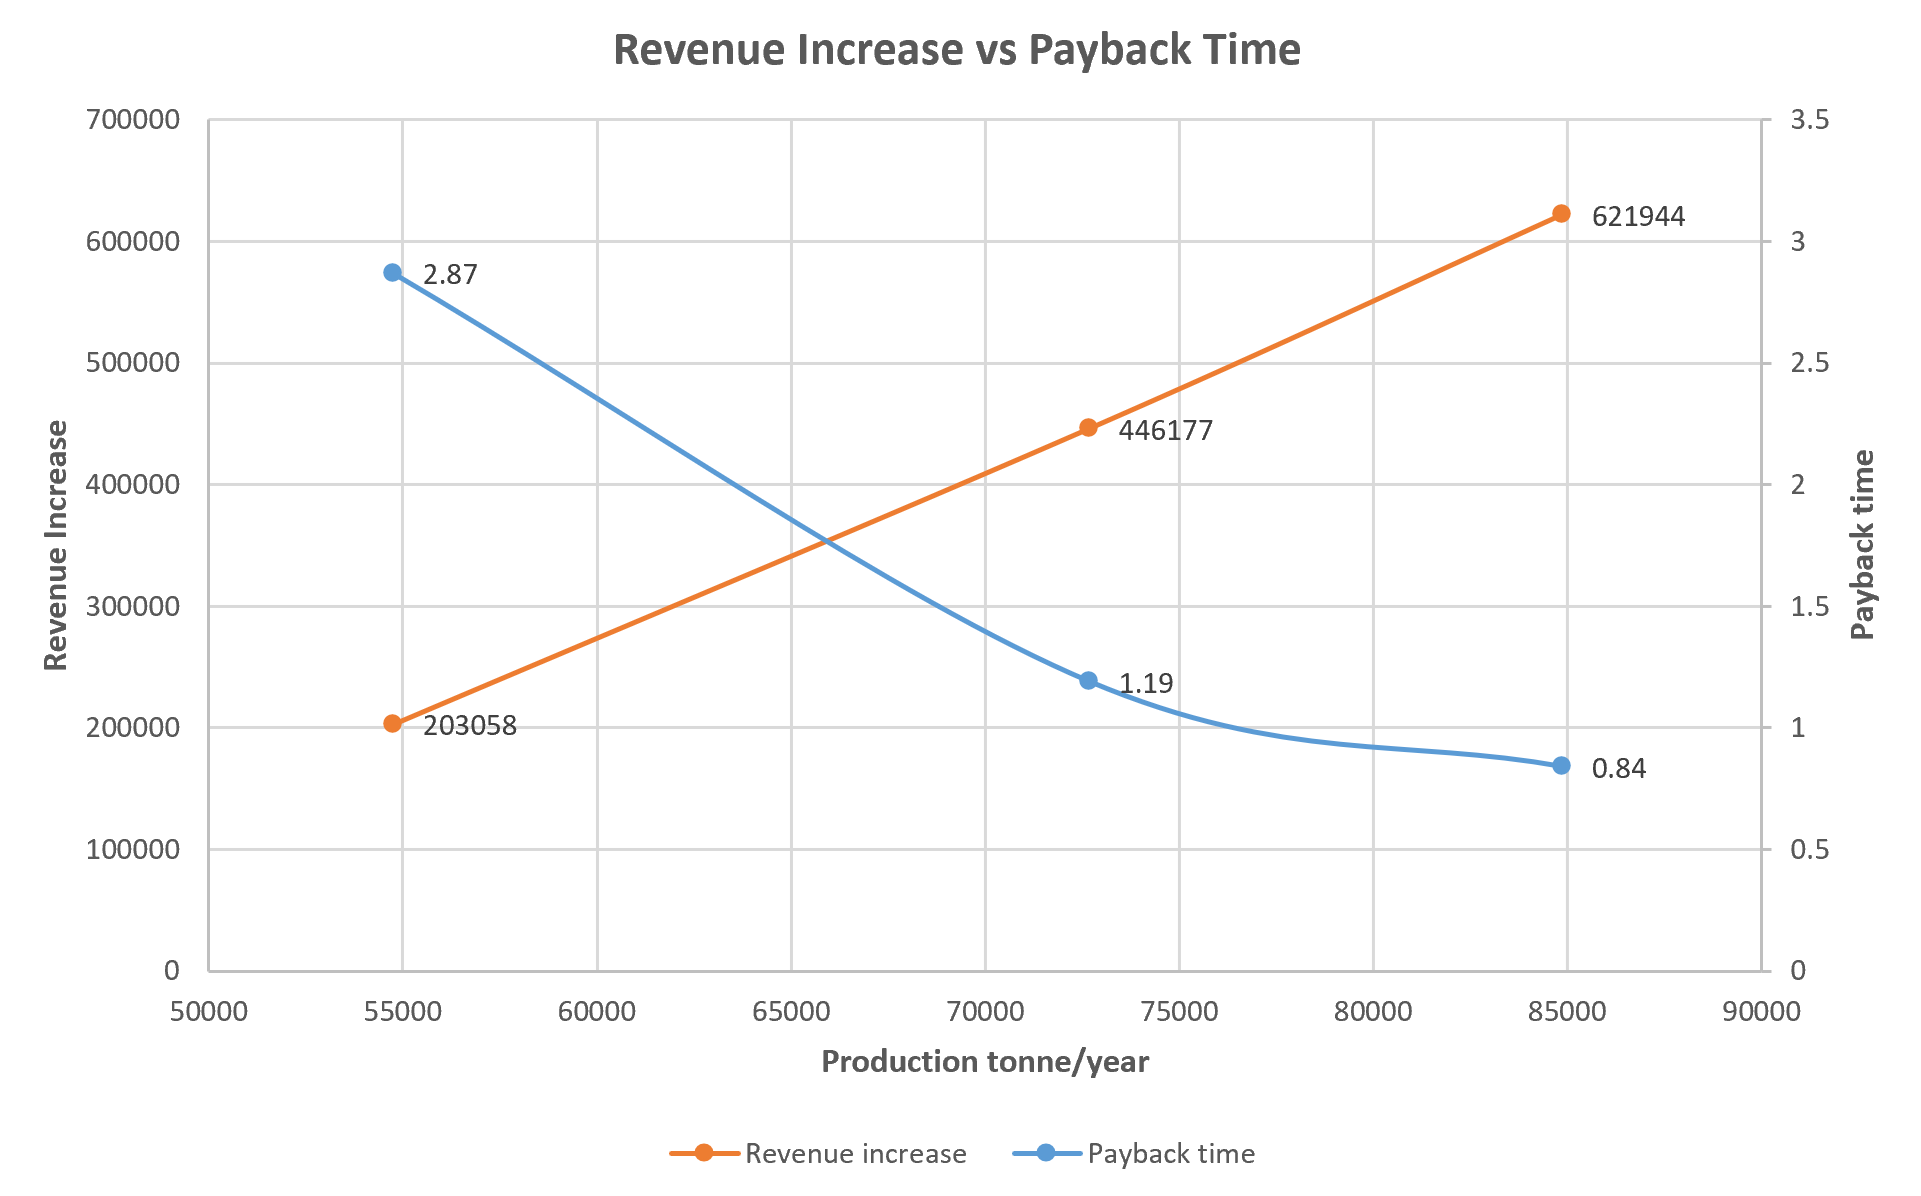
Sort flow sensitivity analysis graph and explanation
As the financial indicators respond strongly to PET price variations, it can be observed from graph low PET prices (£325 /ton), the annual net revenue improvement is around £446,177 /year which increases the payback period to 1.19 years as the production of PET is 3,208.44 t/year out of 72,694.02 t/year. At high PET prices (£350 /ton), the annual net revenue reaches £1,129,475 /year (with increase of 526,854) which lowers the payback to sharp 1 year.
Similarly, larger plants processing 3,763.02 t/year PET (total throughput is 84,972.31 t/year) would generate approximately £1,222,982 / year of revenue in the high‑price scenario and around £1,317,057 in low -price scenario with addition of revenue with (£621,944/year and £716,019 /year respectively), reducing payback time to fastest 0.84 years.
In contrast, a small plant processing only 2,524.33 t/year (total throughput 54,765.4 t/year at a low-price scenario would need almost 2.87 years to recover its investment with revenue of £804,096 in low price scenario and £865,949 in high price scenario which is additional revenue £203,058/year and £264,911/year, respectively.
Key Takeaways
The analysis demonstrates that installing a PET clean-up NIR stage can be financially attractive even under currently depressed PET price conditions. The improvement in purity not only increases the value of each ton of PET produced but also allows MRFs to access higher value markets and establish stronger commercial relationships with converters. Significantly, the benefit scales both with the material price and the amount of PET processed. In other words, high-throughput plants obtain a faster return than small facilities and the price recovery is also critical as once PET prices return to their long-term average, the investment becomes viable for virtually all MRF sizes. Operators should also remain mindful of upcoming policy changes, particularly in the UK where the Deposit Return Scheme (DRS) will initially target PET bottles and aluminum cans. This will significantly reduce the PET fraction arriving at MRFs, reshaping feedstock composition and influencing the economics of recovery.
In addition to the financial return, site managers can also consider benefits such as improved customer confidence, compliance with upcoming quality standards and a reduced risk of bale rejection. Costs of installing an additional NIR can vary between plants depending on layout and ease of integration, and in some cases a single unit can be configured to clean up more than one product stream, improving payback.
Overall, adding a PET cleanup NIR increases saleable PET revenue by approximately 10.25 % in the scenario analyzed. Hence, with a CAPEX of £500,000 and an additional OPEX of £29 k/year, the payback period is ~ 1.19 years under average PET price conditions (£325 /ton). At high PET prices, the payback can be reduced to well to sharp 1 year. Furthermore, small plants (< 60 kt/year) should consider market outlooks since payback time will be around 2.87 years while medium‑to‑large‑scale facilities (>80 kt/year) can expect a strong ROI around 118.6% and payback under 1 year even under moderate price conditions.
Strategic Recommendations
For Large Operations (>80,000 tonnes annually)
The investment presents compelling returns and can expect a strong ROI around 118.6% and payback under 1 year even under moderate price scenarios. These facilities should prioritize implementation.
For Medium Operations (60,000-80,000 tonnes annually)
Investment remains attractive with 1.19-year payback under current conditions. Consider market timing and price recovery trends.
For Small Operations (<60,000 tonnes annually)
Carefully evaluate market outlook and regional pricing. With 2.87-year payback periods, these facilities should monitor price recovery before committing.
Conclusion: Making the Investment Decision
Our SortFlow Process analysis demonstrates that PET cleanup sorting can deliver strong financial returns even under current challenging market conditions. The 10.25% increase in saleable PET revenue, combined with access to higher-value markets, creates a compelling investment case for most MRF operators.
However, success depends on thorough evaluation of local market conditions, facility throughput, and regional pricing structures. The modelling scenarios presented here provide a framework for analysis, but operators must validate assumptions against their specific circumstances.
As the recycling industry continues evolving and policy changes reshape feedstock composition, investing in sorting technology that improves product quality positions MRFs for long-term success in an increasingly competitive marketplace.
This analysis was conducted using SortFlow Process, a proprietary mass-balance modelling application. Price assumptions are based on market observations and may vary by region. Operators should verify local conditions before making investment decisions
SortFlow Limited 2025
Author: Gunel Rahimli
Contributors: Patrick Venn and Luc Mallinger
Appendix
A. Equations Used in Calculations
- Extra Revenue (ΔRevenue):
ΔRevenue = (Improved Purity − Baseline Purity) × PET Throughput × PET Price
- ROI:
ROI = (ΔRevenue − ΔOPEX) / CAPEX
- Payback Period:
Payback Period = CAPEX / (ΔRevenue − ΔOPEX)
B. Price References
- PET current market price: https://www.letsrecycle.com/prices/
